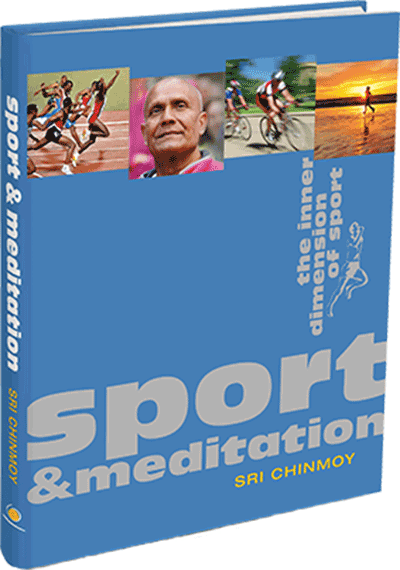

About the author:
Tejvan organises short-distance running and cycling races for the Sri Chinmoy Marathon Team in his home city of Oxford. He is also a very good cyclist, having won the National hill climb championships in 2013 and finished 3rd in the National 100 Mile Time Trials in 2014.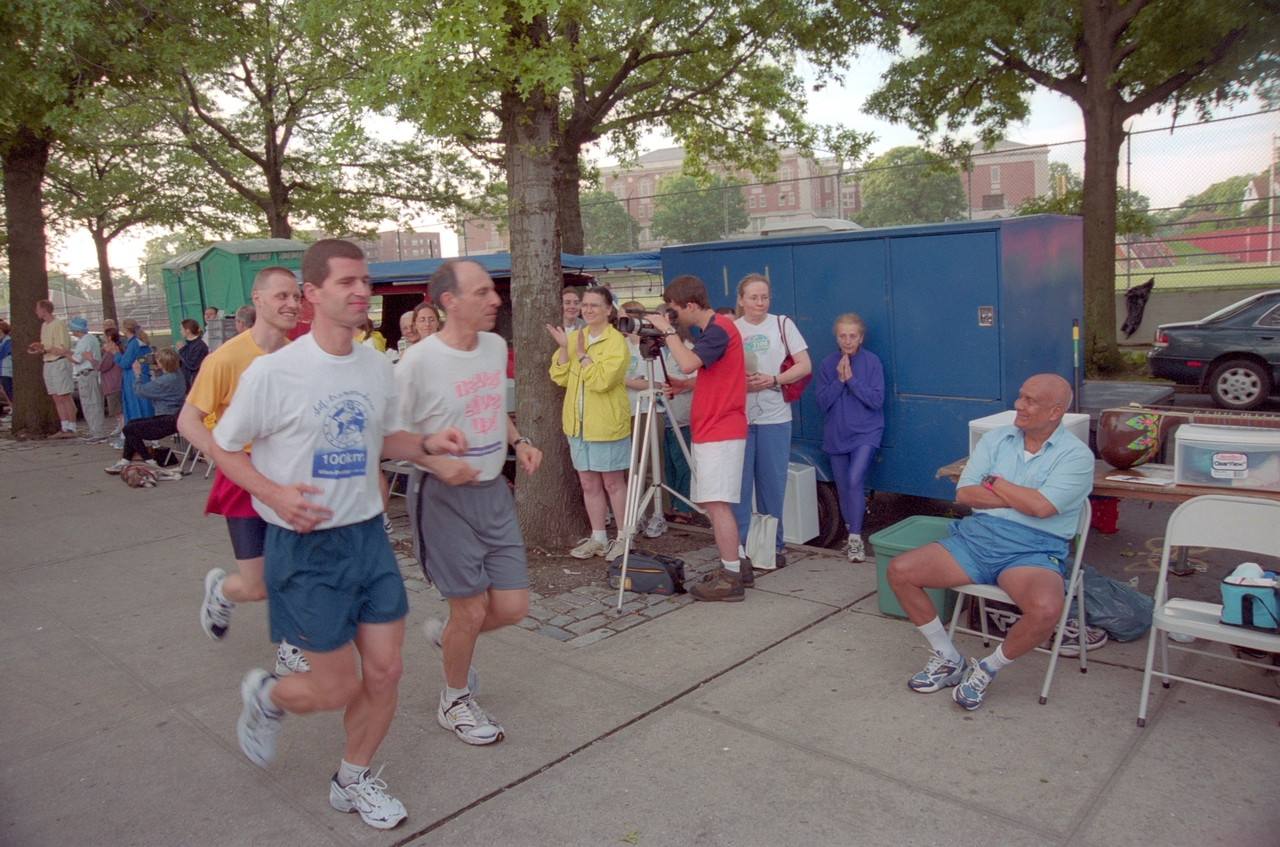
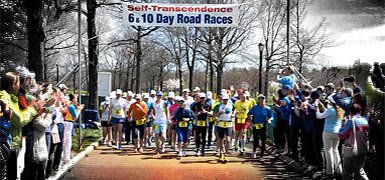
A video about the 3100 Mile Race which includes historic footage from 2005-2007, when the race founder, Sri Chinmoy came to the race. It also features interviews with runners from the 2024 race, who continue this initial inspiration in their own unique way.
 More about:
The 28th Annual Sri Chinmoy Self-Transcendence 3100 Mile Race
Related articles: